I’m trying to represent my data by creating a vertical barplot separated by gender.
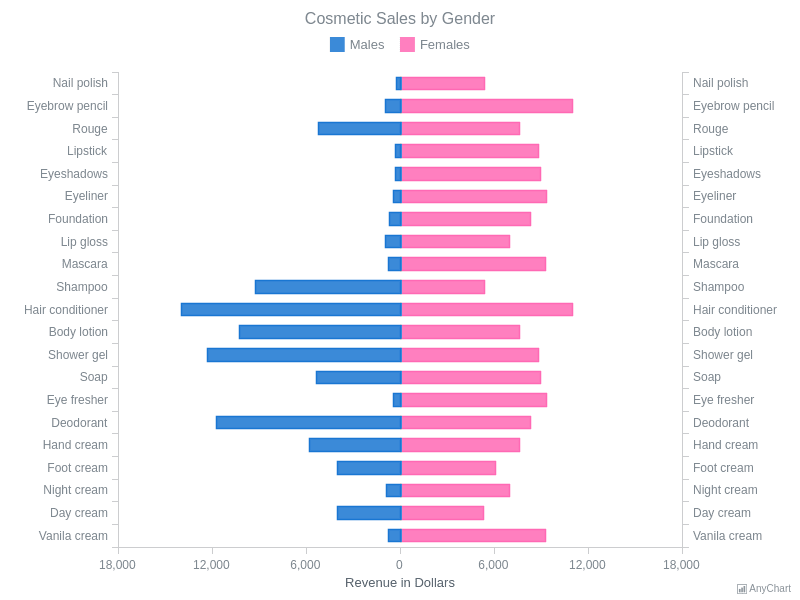
Ideally, I would like the plot to be vertical, with the same axis for males and females almost like this exemple:
I try different geom_bar or geom_histogram but I am not able to have the same axis…
but I don’t understand which value I add in x, or y…
I don’t have negative data, instead of “nail polish” etc I have M1, M2 .. with 5 replicate for each.
Thanks a lot